· Fabian Schreuder · Data Science Projects · 4 min read
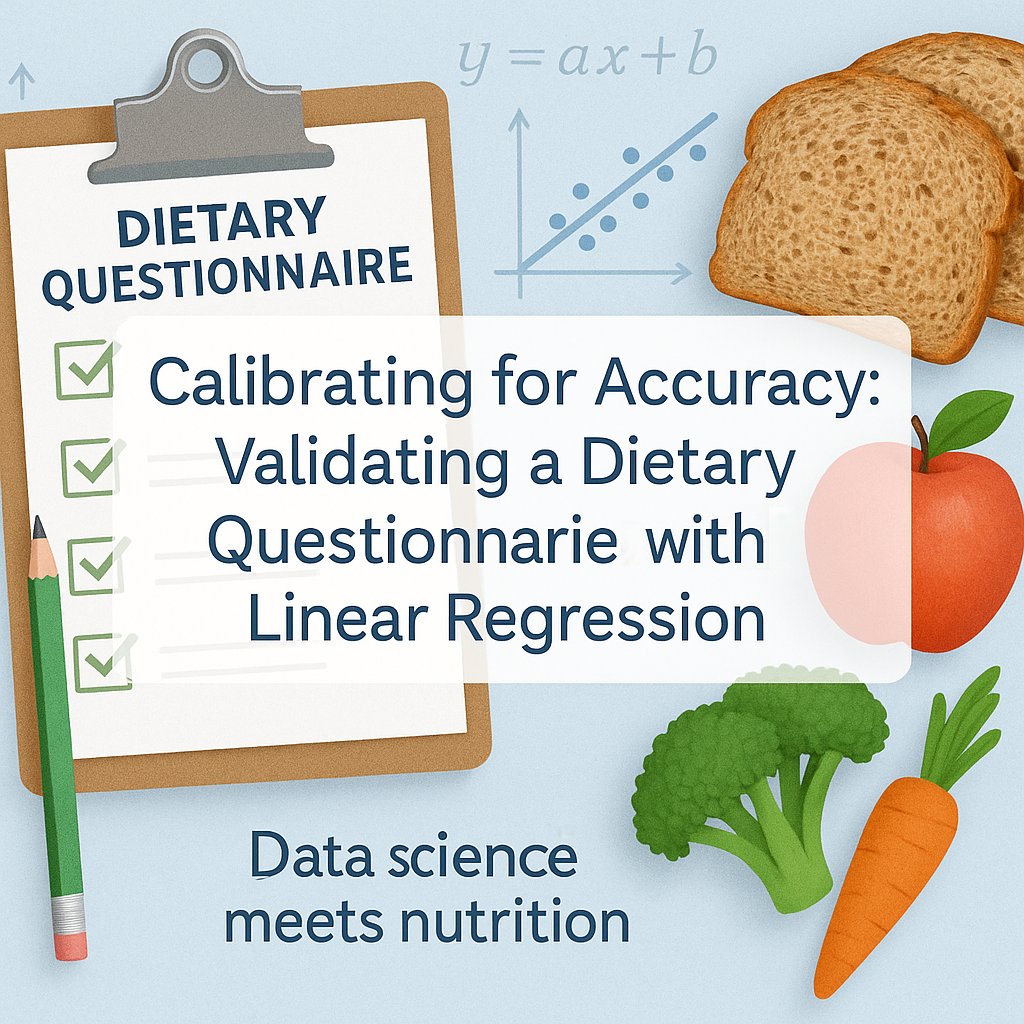
Calibrating for Accuracy: Validating a Dietary Questionnaire with Linear Regression
A case study on validating a new Food Frequency Questionnaire (FFQ) for dietary fiber intake. This post details the use of 24-hour dietary recalls as a reference method and the application of linear regression calibration to correct for measurement error, enhancing data accuracy for epidemiological research.

In the world of health and nutritional epidemiology, the quality of our data is everything. We often rely on self-reported information, which can be noisy and biased. So, how can we correct for these inherent errors to draw more accurate conclusions? In a recent group project, my colleagues and I tackled this exact problem by developing a protocol to validate a new dietary questionnaire.
This post walks through our approach, focusing on the statistical methods we proposed to turn a potentially biased survey tool into a robust instrument for research.
The Challenge: Measuring What We Eat
Accurately measuring dietary intake is crucial for studying the relationship between nutrition and chronic diseases like Irritable Bowel Syndrome (IBS). The Food Frequency Questionnaire (FFQ) is a popular tool for this; it’s inexpensive, scalable, and captures long-term dietary habits, which is exactly what’s needed for epidemiological studies.
However, FFQs have a well-known weakness: they rely on human memory and are prone to both random and systematic errors. Participants might forget what they ate or misreport their consumption, which can distort the data distribution and weaken the statistical power of a study.
Our goal was to validate a newly developed 13-item FFQ designed to measure habitual dietary fiber intake in Dutch adults aged 31-50. Before this FFQ could be used in a larger study on diet and IBS, we had to assess its accuracy and, more importantly, correct for its measurement errors.
Our Solution: Validation and Calibration
Since a perfect “gold standard” measurement for dietary fiber intake doesn’t exist, we had to establish relative validity.
1. Establishing a Reference Point
We chose multiple 24-hour dietary recalls as our reference method. While also a self-report tool, repeated recalls provide a more granular and less biased estimate of short-term intake than an FFQ. Our study design proposed that a sub-sample of 150 participants from the target population would complete both the FFQ and a series of three non-consecutive 24-hour recalls within the same month.
2. Quantifying Error with Linear Regression Calibration
This is where the core of our data science solution lies. Simply comparing the mean intake from the FFQ and the recalls isn’t enough. We proposed using linear regression calibration to create a correction formula.
The idea is to model the relationship between the two measurement methods. We can build a linear model where the “truer” intake (as measured by the 24-hour recalls) is the dependent variable, and the FFQ measurement is the independent variable.
The model would look something like this:
Where:
- is the fiber intake measured by the 24-hour recalls for participant i.
- is the fiber intake measured by the FFQ.
- is the calibration coefficient—the key value that quantifies the error between the two methods.
- is the intercept.
- and represent the person-specific and random errors, respectively.
By fitting this model to the data from our validation study, we can solve for and . These coefficients can then be applied to the FFQ data from the main study to adjust for measurement error, creating a more accurate representation of participants’ fiber consumption.
Visualizing the Impact
As shown in the example plots from our report, we expect to see that the raw FFQ data shows a different distribution (often wider and shifted) compared to the reference data. A Bland-Altman plot would likely highlight the disagreement between the two methods. After applying the calibration coefficient, the adjusted FFQ data should more closely align with the distribution from the 24-hour recalls, reducing bias and improving the validity of any subsequent analysis.
Business Impact and Key Takeaways
This validation protocol has significant practical implications:
- Enhanced Data Integrity: By correcting for measurement error, the calibrated FFQ becomes a much more reliable tool, leading to more trustworthy findings in studies investigating the link between fiber and IBS.
- Cost-Effective Research: The FFQ remains a low-cost, low-burden instrument. The calibration, performed on a smaller subset of participants, enhances the value of the data collected from the entire study population.
- A Demonstrable Framework: This approach serves as a clear framework for validating other dietary or behavioral self-report tools in future projects.
While our approach significantly reduces bias, it’s important to acknowledge its limitations. The 24-hour recall is a reference method, not a perfect gold standard, meaning some residual, unmeasurable bias may remain.
Ultimately, this project demonstrates a critical data science skill: understanding and correcting for the imperfections in our data to build more accurate and impactful models.


